在腳本中搜尋"Up down"
Up/Down Indicator - DurbtradeA simple but unique indicator to show ONLY whether there is an increase or a decrease in price compared to the previous value.
Also includes a customizable SMA or EMA based "Smoothing Length" variable,
allowing the indicator to show whether the SMA or the EMA of the price
is up or down compared to the previous value.
An offset option is also included if you need it.
Settings :
Personal thoughts :
I wanted to have an indicator that showed ONLY whether the price is UP or DOWN from the previous value.
My logic was that I could have a more accurate perception of general up or down trend direction
if I removed the AMOUNT of increase or decrease happening from moment to moment over time.
From there, I added the SMA/EMA "Smoothing Length" and "Smoothing Type" variables into the script.
By increasing the value of the smoothing length above 1,
the indicator act as a color-changing moving average, except without showing an actual value.
"Smooth Length" acts just like the length of any other moving average...
When the value of the "Smooth Length" is = 1, the indicator shows whether PRICE is up or down.
When the value of the "Smooth Length" is = 50, the indicator shows whether the MOVING AVERAGE with a length of 50 is up or down.
When the value of the "Smooth Type" is = 1, the indicator is SMA based.
When the value of the "Smooth Type" is = 2, the indicator is EMA based.
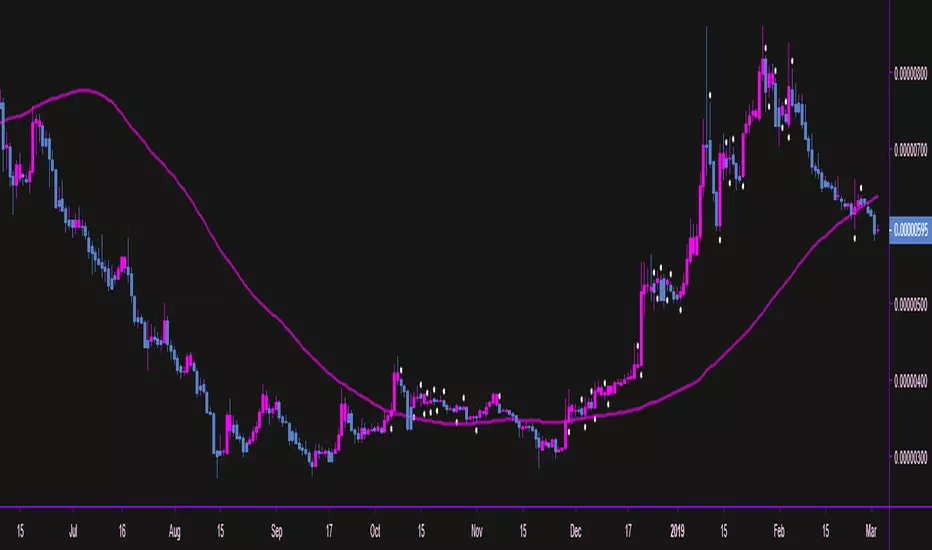
As you can see in the main chart above, or in the picture below, I show the indicator in 2 different ways...
The indicator on the top shows price up/down action,
and the indicator on the bottom shows the 50 SMA up/down action :
Other key points :
The indicator height can be smashed down as small as possible and still remain 100% functional...
which is very important when chart real-estate is limited.
Here is an example of my main layout setup, with the Up/Down indicator on the top left :
As you can see, it takes up very little space, but still remains fully functional.
In the example above, I have it overlayed on the left chart price panel,
with the price visibility turned off.
If it is overlayed on the price panel like so, and you want to see both the indicator and price,
simply turn the price visibility on to see both.
Since the indicator displays itself merely by changing the color of the background,
layer order has no effect, and the indicator is always drawn in the background.
The Up/Down indicator can also be used in conjunction with other candle types
that sometimes display candle color differently than standard candles, such as heikin-ashi candles.
Just take note that the colors of the indicator may not match the colors of the heikin-ashi candles.
Finally, I looked very hard to find an indicator like this on TradingView, and found absolutely nothing.
I know that it is a simple concept, but I'm honestly surprised I couldn't find anything like it.
I have been using it for awhile now, and I'm proud of the results...
therefore, I'd like to share it with the community, along with my previously published indicators,
in the hope that you find it useful!
Outro :
A) As with my previous indicators,
this one was written while keeping information, color, clarity, chart real-estate, and customization in mind.
B) It is optimized to be displayed on all display setups...
for use on your own personal television, laptop, or cellular phone screen...
and on all chart zoom levels and layout styles.
C) Please feel free to comment your thoughts, critiques, or suggestions. They are all very helpful!
D) Check out my previous pine script indicators if you like this one. They work really well together.
E) I hope that you find this script useful.
F) Enjoy!
// Durbtrade

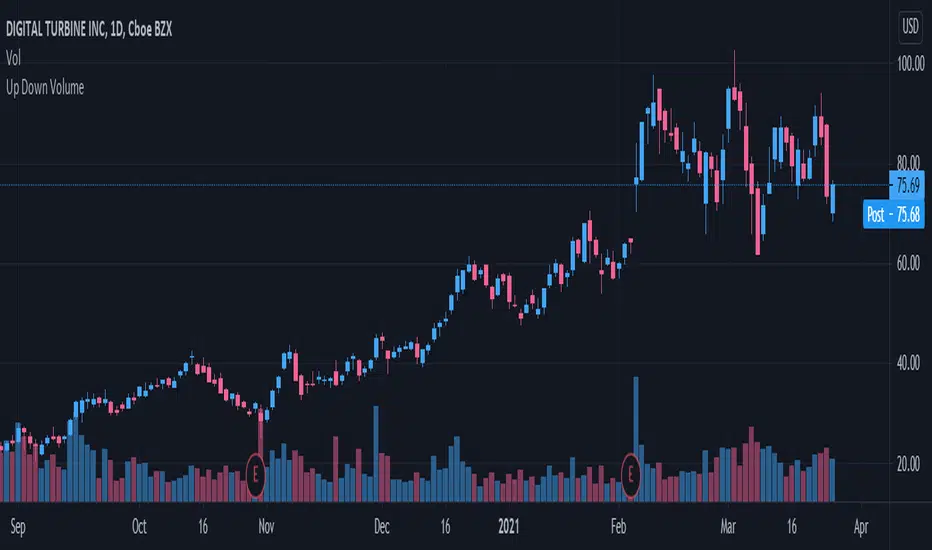
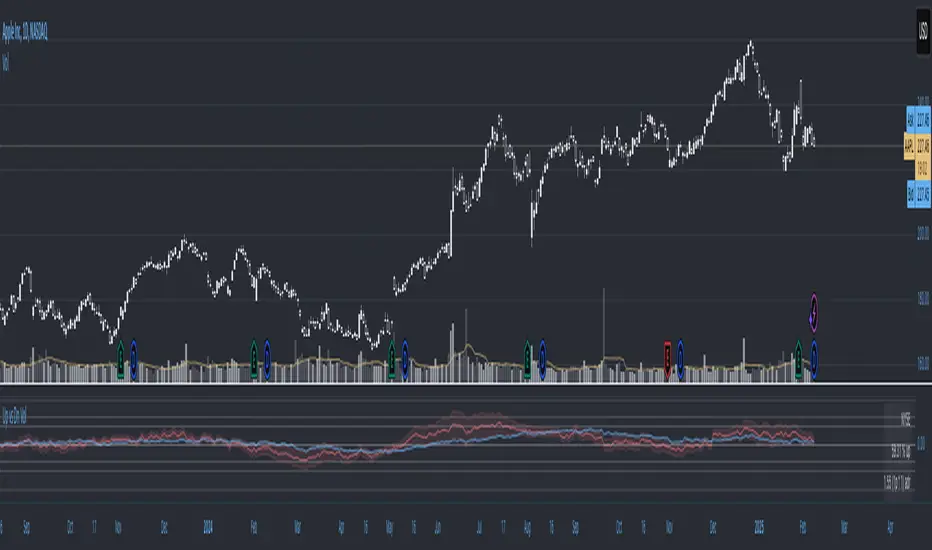
Up/Down Volume RatioUp/Down Volume Ratio is calculated by summing volume on days when it closes up and divide that total by the volume on days when the stock closed down.
High volume up days are typically a sign of accumulation(buying) by big players, while down days are signs of distribution(selling) by big market players. The Up Down volume ratio takes this assumption and turns it into a tangible number that's easier for the trader to understand. My formula is calculated using the past 50 periods, be warned it will not display a value for stocks with under 50 periods of trading history. This indicator is great for identify accumulation of growth stocks early on in their moves, most of the time you would like a growth stocks U/D value to be above 2, showing institutional sponsorship of a stock.
Up/Down Volume value interpretation:
U/D < 1 -> Bearish outlook, as sellers are in control
U/D = 1 -> Sellers and Buyers are equal
U/D > 1 -> Bullish outlook, as buyers are in control
U/D > 2 -> Bullish outlook, significant accumulation underway by market makers
U/D >= 3 -> MONSTER STOCK ALERT, market makers can not get enough of this stock and are ravenous to buy more
U/D values greater than 2 are rare and typically do not last very long, and U/D >= 3 are extremely rare one example I kind find of a stock's U/D peaking above 3 was Google back in 2005.
MAKE SURE TO HIT THE SETTINGS WHEEL AND CHECK THE BOX NEXT TO PLOT IN ORDER TO GET RID OF THE PLOTTED LINE.
Up/Down Volume with Table (High Contrast)Up/Down Volume with Table (High Contrast) — Script Summary & User Guide
Purpose of the Script
This TradingView indicator, Up/Down Volume with Table (High Contrast), visually separates and quantifies up-volume and down-volume for each bar, providing both a color-coded histogram and a dynamic table summarizing the last five bars. The indicator helps traders quickly assess buying and selling pressure, recent volume shifts, and their relationship to price changes, all in a highly readable format.
Key Features
Up/Down Volume Columns:
Green columns represent volume on bars where price closed higher than the previous bar (up volume).
Red columns represent volume on bars where price closed lower than the previous bar (down volume).
Delta Line:
Plots the net difference between up and down volume for each bar.
Green when up-volume exceeds down-volume; red when down-volume dominates.
Interactive Table:
Displays the last five bars, showing up-volume, down-volume, delta, and close price.
Color-coding for quick interpretation.
Table position, decimal places, and timeframe are all user-configurable.
Custom Timeframe Support:
Calculate all values on the chart’s timeframe or a custom timeframe of your choice (e.g., daily, hourly).
High-Contrast Design:
Table and plot colors are chosen for maximum clarity and accessibility.
User Inputs & Configuration
Use custom timeframe:
Toggle between the chart’s timeframe and a user-specified timeframe.
Custom timeframe:
Set the timeframe for calculations if custom mode is enabled (e.g., "D" for daily, "60" for 60 minutes).
Decimal Places:
Choose how many decimal places to display in the table.
Table Location:
Select where the table appears on your chart (e.g., Bottom Right, Top Left, etc.).
How to Use
Add the Script to Your Chart:
Copy and paste the code into a new Pine Script indicator on TradingView.
Add the indicator to your chart.
Configure Inputs:
Open the indicator settings.
Adjust the timeframe, decimal places, and table location as desired.
Read the Table:
The table appears on your chart (location is user-selectable) and displays the following for the last five bars:
Bar: "Now" for the current bar, then "Bar -1", "Bar -2", etc. for previous bars.
Up Vol: Volume on bars where price closed higher than previous bar, shown in black text.
Down Vol: Volume on bars where price closed lower than previous bar, shown in black text.
Delta: Up Vol minus Down Vol, colored green for positive, red for negative, black for zero.
Close: Closing price for each bar, colored green if price increased from previous bar, red if decreased, black if unchanged.
Interpret the Histogram and Lines:
Green Columns:
Represent up-volume. Tall columns indicate strong buying volume.
Red Columns:
Represent down-volume. Tall columns indicate strong selling volume.
Delta Line:
Plotted as a line (not a column), colored green for positive values (more up-volume), red for negative (more down-volume).
Large positive or negative spikes may indicate strong buying or selling pressure, respectively.
How to Interpret the Table
Column Meaning Color Coding
Bar "Now" (current bar), "Bar -1" (previous bar), etc. Black text
Up Vol Volume for bars with higher closes than previous bar Black text
Down Vol Volume for bars with lower closes than previous bar Black text
Delta Up Vol - Down Vol. Green if positive, red if negative, black if zero Green/Red/Black
Close Closing price for the bar. Green if price increased, red if decreased, black if unchanged Green/Red/Black
Green Delta: Indicates net buying pressure for that bar.
Red Delta: Indicates net selling pressure for that bar.
Close Price Color:
Green: Price increased from previous bar.
Red: Price decreased.
Black: No change.
Practical Trading Insights
Consistently Green Delta (Histogram & Table):
Sustained buying pressure; may indicate bullish sentiment or accumulation.
Consistently Red Delta:
Sustained selling pressure; may indicate bearish sentiment or distribution.
Large Up/Down Volume Spikes:
Big green or red columns can signal strong market activity or potential reversals if they occur at trend extremes.
Delta Flipping Colors:
Rapid alternation between green and red deltas may indicate a choppy or indecisive market.
Close Price Color in Table:
Use as a quick confirmation of whether volume surges are pushing price in the expected direction.
Troubleshooting & Notes
No Volume Data Error:
If your symbol doesn’t provide volume data (e.g., some indices or synthetic assets), the script will display an error.
Custom Timeframe:
If using a custom timeframe, ensure your chart supports it and that there is enough data for meaningful calculations.
High-Contrast Table:
Designed for clarity and accessibility, but you can adjust colors in the code if needed for your personal preferences.
Summary Table Legend
Bar Up Vol Down Vol Delta Close
Now ... ... ... ...
Bar-1 ... ... ... ...
... ... ... ... ...
Colors reflect the meaning as described above.
In Summary
This indicator visually and numerically breaks down buying and selling volume, helping you spot shifts in market sentiment, volume surges, and price/volume divergences at a glance.
Use the table for precise recent data, the histogram for overall flow, and the color cues for instant market context.


Up/Down Range MomentumThe Up/Down Range breaks the price range into an upward and a downward moving component, so we can easily turn it into a momentum oscillator. This script does just that.
You can find the Up/Down Range (UDR) indicator here:
Column Up or DownThis is the same as my background up/down except it displays a column to show if the stock is above or below the previous day close.
When looking at numerous charts, you can instantly see if they are up or down for the day. For me, I like to be going long on the stocks that are already moving up and short on the ones that are moving down. When using lower time frames, you can lose perspective of where it is on the daily chart .

Up Down Volume Ratio by 3iauThis script considers the total volume within a user specified time frame, and whether price closed higher or lower at the end of each period within that time frame.
EXAMPLE:
* If the time period of interest is 50-periods, the script considers the volume within each of those 50 periods beginning with the most recent closed period.
* SumUpVol = the sum of all volume occurring within only those periods where price closed higher than that of the previous period.
* SumDnVol = the sum of all volume occurring within only those periods where price closed lower than that of the previous period.
* Difference = the difference between SumUpVol and SumDnVol = SumUpVol - SumDnVol
* Total = the sum of SumUpVol and SumDnVol = SumUpVol + SumDnVol
* The plot will present the change in Difference divided by Total = Difference/Total = (SumUpVol - SumDnVol)/(SumUpVol + SumDnVol) occurring within those 50 periods. What will be plotted is the moving average of this value. The user can specify the moving average type and the number of period for which the average is calculated.
* The plot needs to be fitted into a range, for example, +/- 50 (default) or +/-100, by multiplying the result of Difference/Total by a user specified constant. The constant will contain the majority (not all) of the values within +/- the specified value.
* Range = the user specified constant. If Range = 50, the majority of values plotted will be fall within the range +/- 50.
* Therefore, what is plotted is the moving average of Range * Difference / Total.
* When the value = 0, accumulation = distribution over the user specified 50-periods time frame.
* When the value is positive, accumulation > distribution over the user specified 50-periods time frame.
* When the value is negative, distribution > accumulation over the user specified 50-periods time frame.
This plot allows one to see possible accumulation and distribution occurring within a particular stock. The slope of this plot must be considered, and not any single value. The selected constant (“Range” in the example above) does not have an effect on the slope of the plot.
Three values may be plotted at once, for comparison of accumulation or distribution occurring over different time frames. For example, compare Difference / Total calculated over a 50-periods timeframe with 10-periods timeframe, both time frames beginning with the most recent closed period.
In addition to the above, J. Welles Wilder’s Relative Strength Index (RSI) can be plotted over the Difference / Total.
NOTE: this script is not the same as the more commonly used Up/Down Volume Ratio defined as SumUpVol / SumDnVol over a 50-periods time frame, where SumUpVol = the sum of all volume occurring within only those periods where price closed higher than that of the previous period, and SumDnVol = the sum of all volume occurring within only those periods where price closed lower than that of the previous period.
Compare...
Up Down Volume Ratio = SumUpVol / SumDnVol
Up Down Volume Ratio by 3iau = the moving average of Range * (SumUpVol - SumDnVol) / (SumUpVol + SumDnVol)
Up/Down Vol RatioThe Up/Down Volume Ratio is a tool utilized by investors.com. They describe it as "A 50-day ratio that is derived by dividing total volume on up days by the total volume on down days. A ratio greater than 1.0 implies positive demand for a stock."
It is best used to confirm buying or selling pressure in your stock in conjunction with price analysis.
Acknowledgment
The formula is obtained from the investors.com education section: education.investors.com
Thank you to @JohnMuchow for upgrading my code for best practices when publishing.

Up/Down Strategy - ContrarianThis is a consecutive bar up/down strategy for going long when the short condition is met or going short when the long condition is met. This is known in trading as taking contrarian signals and is helpful when an asset can provide only losses with a given strategy. In theory taking the opposing trade should produce a profit. With this strategy you can specify how many bars down to enter long and how many bars up to enter short. It also has code to check and make sure the condition is still true when launching the official alert, which helps back testing and live results line up, however be sure to enter commission and slippage into the properties to accurately reflect profits. I added back testing date ranges to this so you can easily pull up and see back tested results for a certain date range. I also added a buy and sell messages, close messages and take profit/stop loss message fields in the properties so you can launch alerts that will work with automated trading services. Simply enter your messages into those fields in the properties and then when you create an alert enter {{strategy.order.alert_message}} into the alert body and it will dynamically pull in your buy and sell messages when it fires alerts. I also added time restriction so you can enter trades only during the time frame specified. You can change it to any time frame, such at 0930-1600. Set the time restriction field to empty by default since otherwise the strategy won't take all trades like normal. So to enable time restriction enter a time frame in the format 0000-0000. I also added the ability to check off a box that will close the open trade at the end of the time restriction. So if you set the time frame to 0930-1600 and check off to enable close trade at end of time frame then it will look to exit the trade at the close of the next bar.

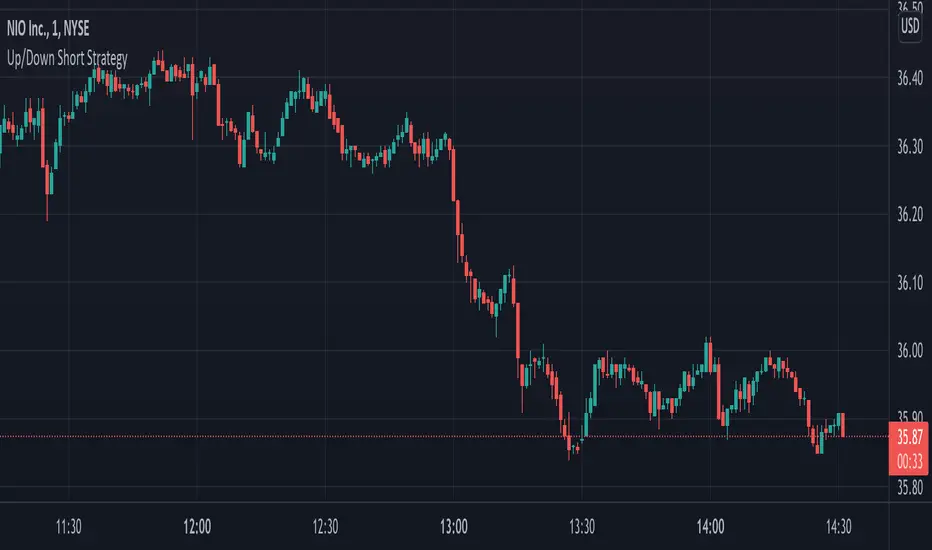
Up/Down Short StrategyThis is a consecutive bar up/down strategy for going short only where you can specify how many bars down to enter and how many bars up to exit. It also has code to check and make sure the condition is still true when launching the official alert, which helps back testing and live results line up, however be sure to enter commission and slippage into the properties to accurately reflect profits. I added back testing date ranges to this so you can easily pull up and see back tested results for a certain date range. I also added a buy and sell messages, close messages and take profit/stop loss message fields in the properties so you can launch alerts that will work with automated trading services. Simply enter your messages into those fields in the properties and then when you create an alert enter {{strategy.order.alert_message}} into the alert body and it will dynamically pull in your buy and sell messages when it fires alerts. I also added time restriction so you can enter trades only during the time frame specified. You can change it to any time frame, such at 0930-1600. Set the time restriction field to empty by default since otherwise the strategy won't take all trades like normal. So to enable time restriction enter a time frame in the format 0000-0000. I also added the ability to check off a box that will close the open trade at the end of the time restriction. So if you set the time frame to 0930-1600 and check off to enable close trade at end of time frame then it will look to exit the trade at the close of the next bar.
Up/Down Long StrategyThis is a consecutive bar up/down strategy for going long only where you can specify how many bars up to buy and how many bars down to sell. It also has code to check and make sure the condition is still true when launching the official alert, which helps back testing and live results line up, however be sure to enter commission and slippage into the properties to accurately reflect profits. I added back testing date ranges to this so you can easily pull up and see back tested results for a certain date range. I also added a buy and sell message fields in the properties so you can launch alerts that will work with automated trading services. Simply enter your buy message and sell message into those fields in the properties and then when you create an alert enter {{strategy.order.alert_message}} into the alert body and it will dynamically pull in your buy and sell messages when it fires alerts.

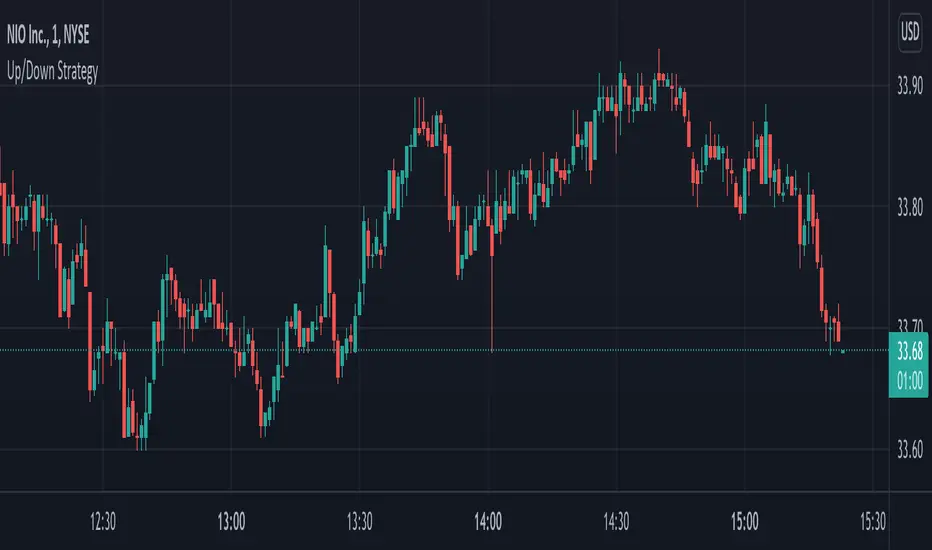
Up/Down StrategyThis is a consecutive bar up/down strategy where you can specify how many bars up to buy and how many bars down to sell. It also has code to check and make sure the condition is still true when launching the official alert, which helps back testing and live results line up, however be sure to enter commission and slippage into the properties to accurately reflect profits. I added back testing date ranges to this so you can easily pull up and see back tested results for a certain date range. I also added a buy and sell message fields in the properties so you can launch alerts that will work with automated trading services. Simply enter your buy message and sell message into those fields in the properties and then when you create an alert enter {{strategy.order.alert_message}} into the alert body and it will dynamically pull in your buy and sell messages when it fires alerts.
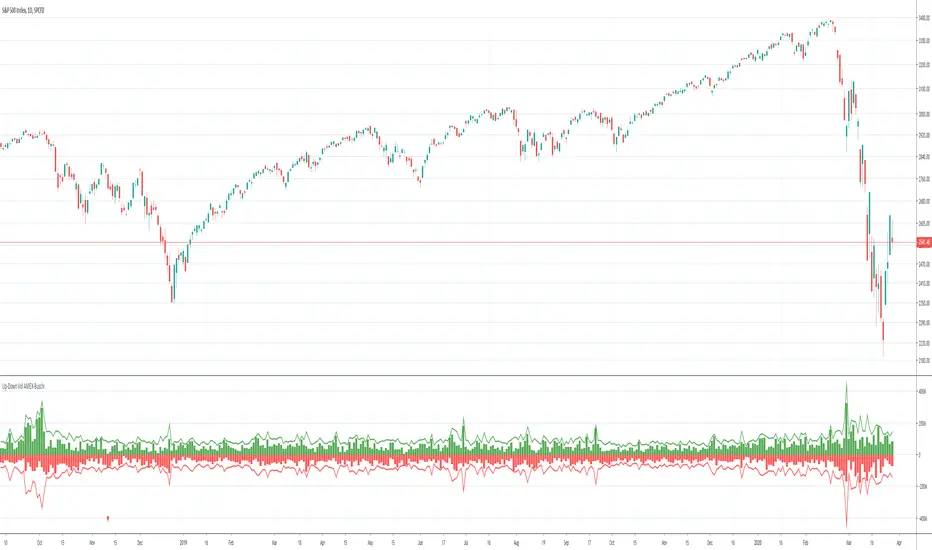
Up-Down Volume AMEX-Buschi
English:
This indicator shows the AMEX's up volume (green) and down volume (red).
Extreme trading days with more than 90 % up or down volume are marked via lines (theoretically values) and triangles (breaches).
Deutsch:
Dieser Indikator zeigt das Aufwärts- (grün) und Abwärts-Volumen (rot) der AMEX.
Extreme Handelstage mit mehr als 90 % Aufwärts- oder Abwärts-Volumen ist gekennzeichnet über Linien (theoretische Werte) und Dreiecke (Überschreitungen).
Up-Down Volume NASDAQ-Buschi
English:
This indicator shows the NASDAQ's up volume (green) and down volume (red).
Extreme trading days with more than 90 % up or down volume are marked via lines (theoretically values) and triangles (breaches).
Deutsch:
Dieser Indikator zeigt das Aufwärts- (grün) und Abwärts-Volumen (rot) der NASDAQ.
Extreme Handelstage mit mehr als 90 % Aufwärts- oder Abwärts-Volumen ist gekennzeichnet über Linien (theoretische Werte) und Dreiecke (Überschreitungen).

Up-Down Volume NYSE-Buschi
English:
This indicator shows the NYSE's up volume (green) and down volume (red).
Extreme trading days with more than 90 % up or down volume are marked via lines (theoretically values) and triangles (breaches).
Deutsch:
Dieser Indikator zeigt das Aufwärts- (grün) und Abwärts-Volumen (rot) der NYSE.
Extreme Handelstage mit mehr als 90 % Aufwärts- oder Abwärts-Volumen ist gekennzeichnet über Linien (theoretische Werte) und Dreiecke (Überschreitungen).

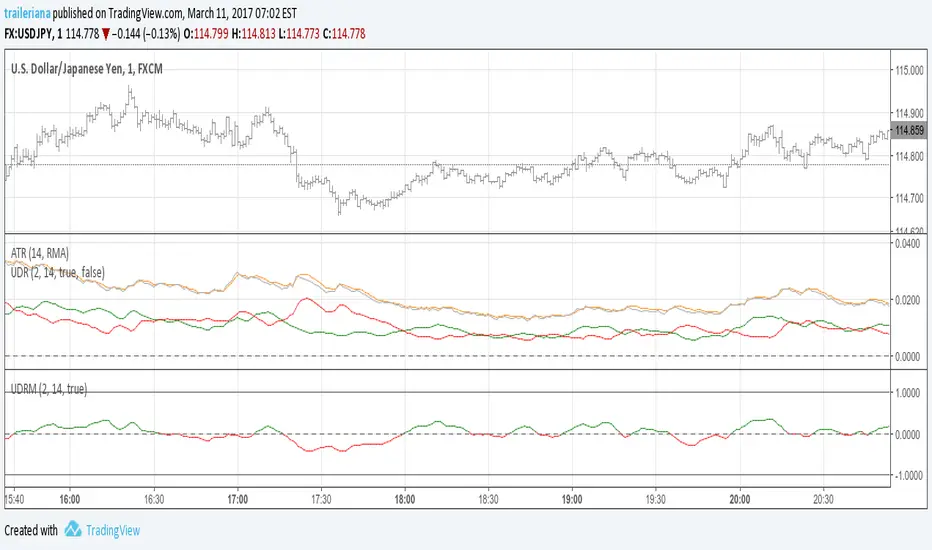
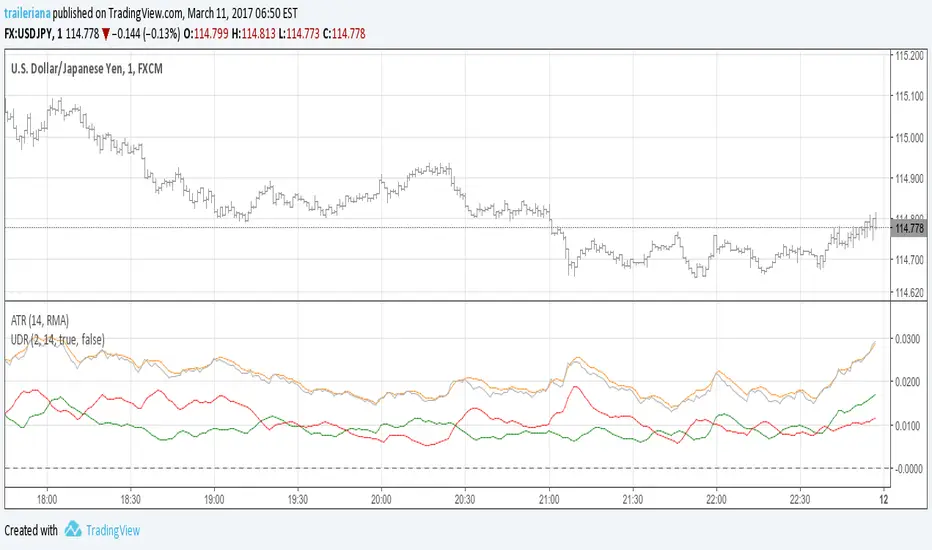
Up/Down RangeMeasuring the difference between the highs and lows from the average, this measure can serve as a proxy for the volatility, just like the ATR.
However, it breaks the range into an upward and a downward moving component, so it also gives information about the current trend direction.
In fact, I turned it into a momentum indicator here:
Up/Down Volume Delta %this script is based on FractalTrade_'s rendition of the up/down volume bars.
the shortcomings of that chart were that large volume bars caused the auto-scaling to shrink smaller volume bar displays to the point where much of the data was too small to see.
in this chart, the bars are displaying the percent delta out of the total bar volume. this way, large overall volume bars do not cause visual compression to everything else in the chart.
I've used color modulation to indicate relation to a relative volume point, so users can still tell when overall volume is large or small. when volume is under a moving average, the bars will display at a basis transparency. when the volume is over the average, the brightness will increase up to a specific ratio of volume defined by the user.
for example, if basis transparency is at 20, and the full opacity ratio is at 3, and the volume average is at 1M, a volume of 750k will display the delta bar at the basis transparency. a volume of 3M will achieve full brightness. a volume of 2M will display with moderate brightness (about 60%), but still stand out against other bars with basis transparency.
areas of the chart that are either increasing bar sizes or increasing in brightness can indicate directional force. when volume delta direction contradicts the candle direction, this can indicate support / resistance.

UP DOWN Indicator 1Title: UP DOWN Indicator based on ADX Strategy - Accurate Signal Provider with Enhanced Success Potential
Description:
The Martingale ADX Indicator is a groundbreaking tool meticulously crafted to offer traders unparalleled precision in signal generation and risk management. Leveraging the power of the Average Directional Index (ADX), this indicator provides 100% non-repaint signals on the current candle, guiding traders to opportune and prepare for trade entry with remarkable accuracy.
With a focus on empowering traders across various financial markets, including Forex and Binary Options, this ADX Strategy-1 Indicator introduces a unique approach to trading dynamics. By seamlessly integrating the renowned Martingale Step-1 risk management strategy, this indicator not only minimizes losses but also enhances the potential for success, even in volatile market conditions.
Key Features:
Non-Repaint Signals: The Martingale ADX Indicator stands as a testament to reliability, offering 100% non-repaint signals. Traders can trust in the consistency and not removing losing Signals which is very important to trust the previous generated signals also, eliminating uncertainties and facilitating confident decision-making.
ADX-Based Precision: Built upon the robust framework of the Average Directional Index (ADX), this indicator delivers precise signals tailored to prevailing market trends and volatility levels. Whether trading in longer timeframes or engaging in Binary Options, traders can rely on the Martingale Step-1 ADX Indicator for superior insights.
Next Candle Trading: Seamlessly integrated into trading strategies, signals from the Martingale ADX Indicator prompt action on the subsequent candle. This real-time approach ensures traders stay ahead of market movements, seizing opportunities as they emerge. Giving Signals Once Candle ahead makes traders to prepare early and decide whether they want to enter the trade on presented Signal or not as per their own experience too. If the trading candle is loss then the very next candle shall be used for taking Martingale Sep-1 to enhance the Accuracy.
Enhanced Success Potential: With Martingale Step-1 risk management, this ADX Indicator offers more than just signal accuracy – it presents the potential for heightened success rates. Through strategic position sizing and leveraging experience and Price Action insights, traders can elevate overall accuracy to levels ranging from 80% to 90%.
Conclusion:
The UP DOWN Strategy-1 Indicator represents a paradigm shift in trading technology, combining precision signal generation with advanced risk management strategies. Whether you're a seasoned trader or just starting your journey, this indicator empowers you to navigate financial markets with confidence and achieve consistent results.
Experience the difference with the Martingale ADX Indicator – where reliability meets profitability, and success becomes attainable with every trade.
Trade wisely, and may your ventures be marked by prosperity and fulfillment.
Pardon for any descriptive language grammatical error and comment about this indicator and to get my other strategy as well. Happy trading !!
Risk Disclaimer:
Trading in financial markets carries inherent risks and should be approached with caution. It is imperative to exercise sound judgment and trade only with funds that you can afford to lose. We strongly advise against using borrowed funds for trading purposes. First practice on demo for own learning then make decision wisely.

Up/Down Volume + DeltaThis simple script is a modification of Tradingview's Up/Down Volume. In this case the delta between the buys and sells is plotted in columns style above the regular up/down volume columns. This gives a better visual of the dominant volume and is useful to spot divergences in tops and bottoms.
The indicators uses data from lower timeframe volumes. By default the lowest timeframe it will use is 1m, but for those that have a premium account you can try using a custom LTF set to seconds when scalping on the 1m chart.
Enjoy :)

Up Down Alerts with MA Control - v2.0this update is meant for use with regular candles, but it will mimic the color pattern of heikin ashi candles and allow alerts based on the heikin ashi patterns. Also there are alerts for when the price is above a set moving average.
was going to just update the original script but there are a lot of changes to make it smoother etc, original script:
Up/Down Range Momentum MTFSo using the script of
and adding non repainting MTF function to it we create this momentum model
You can enter either at cross of blue line or at cross of 0 and vice versa at red line.
since it has MTF function you can look it on different time frames just set int 2 to the TF of your desire

Up Down Alerts with MA Controlsimple up down candle alerts with a built in MA control
backtesting script:
